
Slope Lab is a 21-lesson, 25–30 hour hands-on Math Lab. Students build a Gravity Racer using Circuit Cubes™ kits, roll it down ramps, collect real distance and time data, and make graphs. Then, they build a Motor Racer — a vehicle that moves at a fixed rate. Using this data, students work through challenges involving rate, slope, and linear equations.
Students start by measuring and recording — physical data from physical ramps. They organize their data into tables, plot it on coordinate grids, and look for patterns. From there, they calculate unit rate, identify slope in their own graphs, and write equations in y = mx + b form. The progression moves from collecting data with tape measures and stopwatches, to representing it on graphs, to writing equations that model what they measured.
How the Curriculum Works
Students assemble a motorless Gravity Racer, then progress through data collection, graphing, slope, and linear equations:
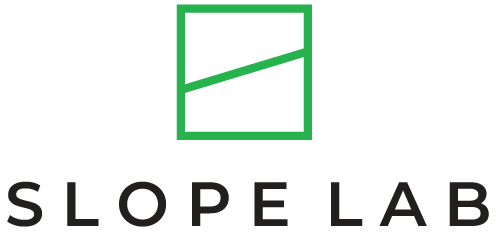
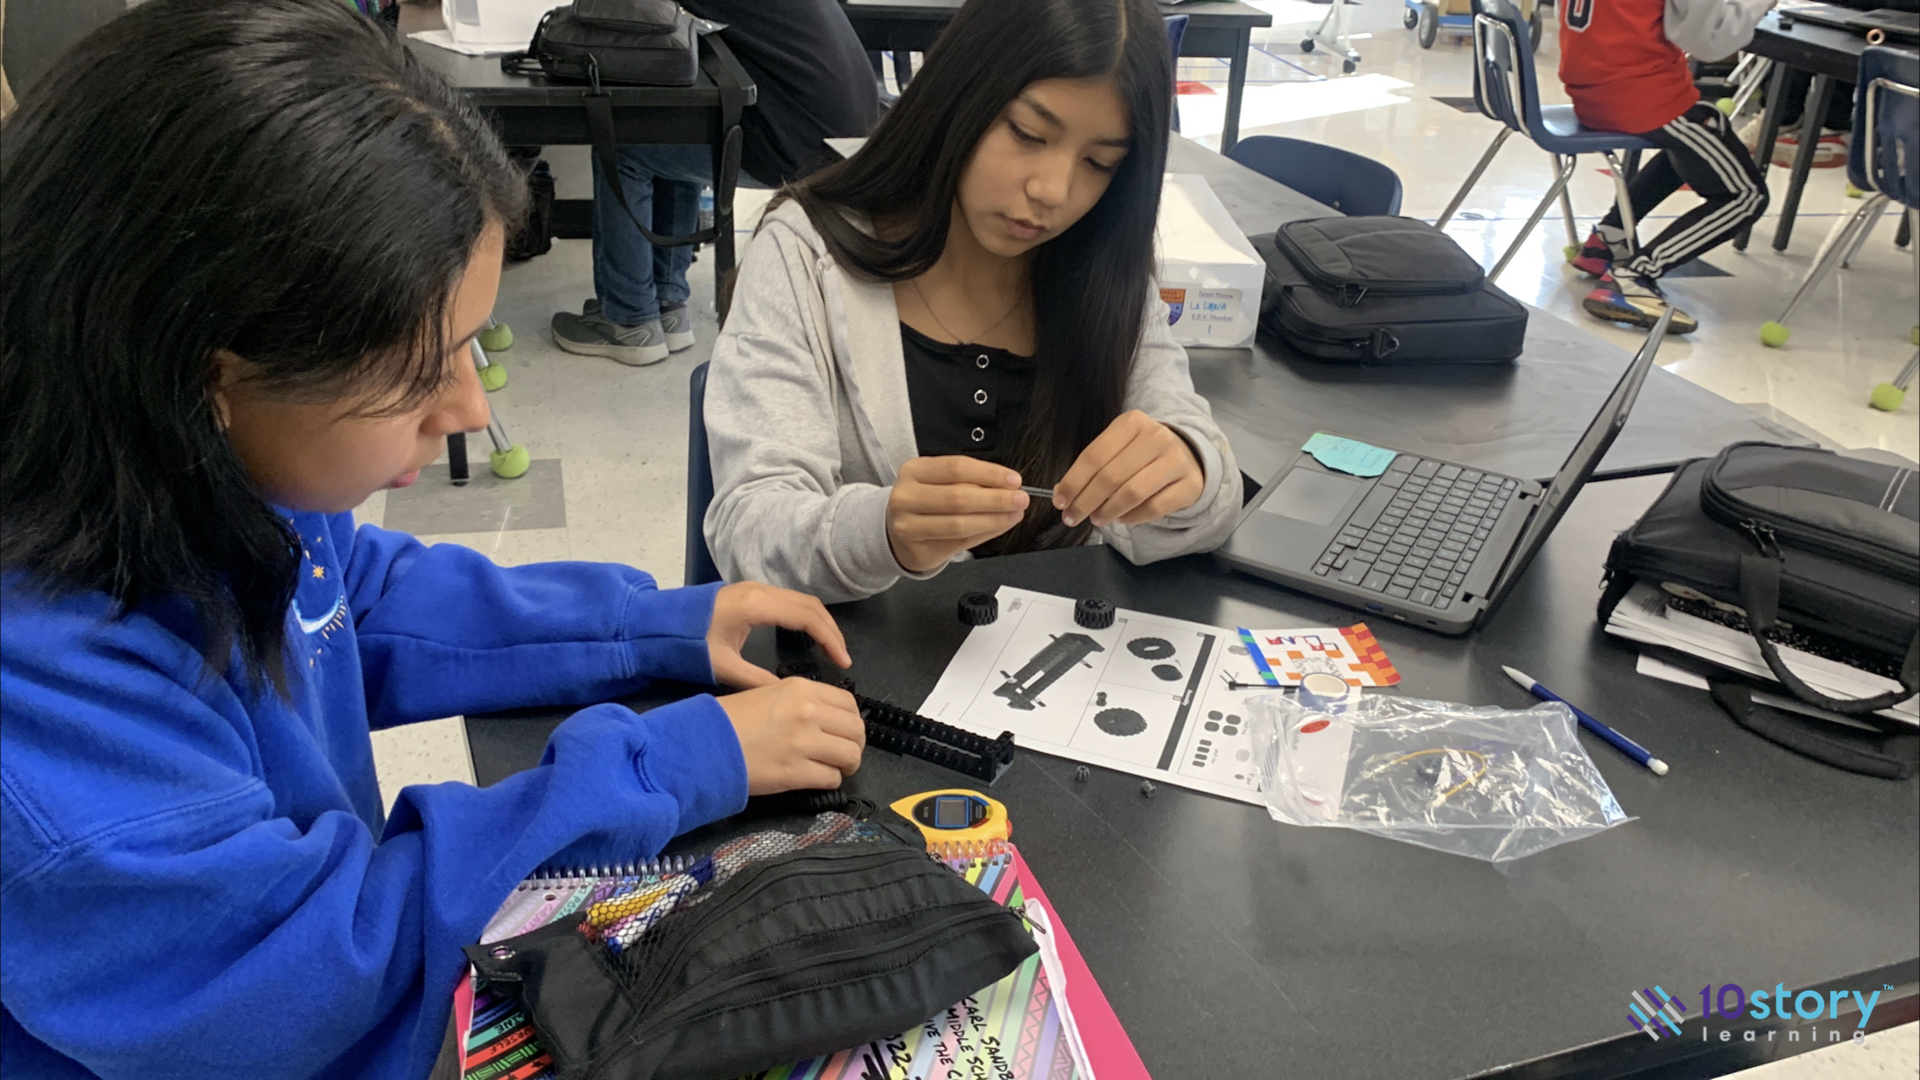
- Lessons 1–4: Students build the Gravity Racer from Circuit Cubes™ parts, roll it down ramps at different heights, measure distance with tape measures, time with stopwatches, and record trials on data sheets.
- Lessons 5–7: Students compare runs — some show constant rate, some show changing rate. They identify the difference by looking at their tables and graphs.
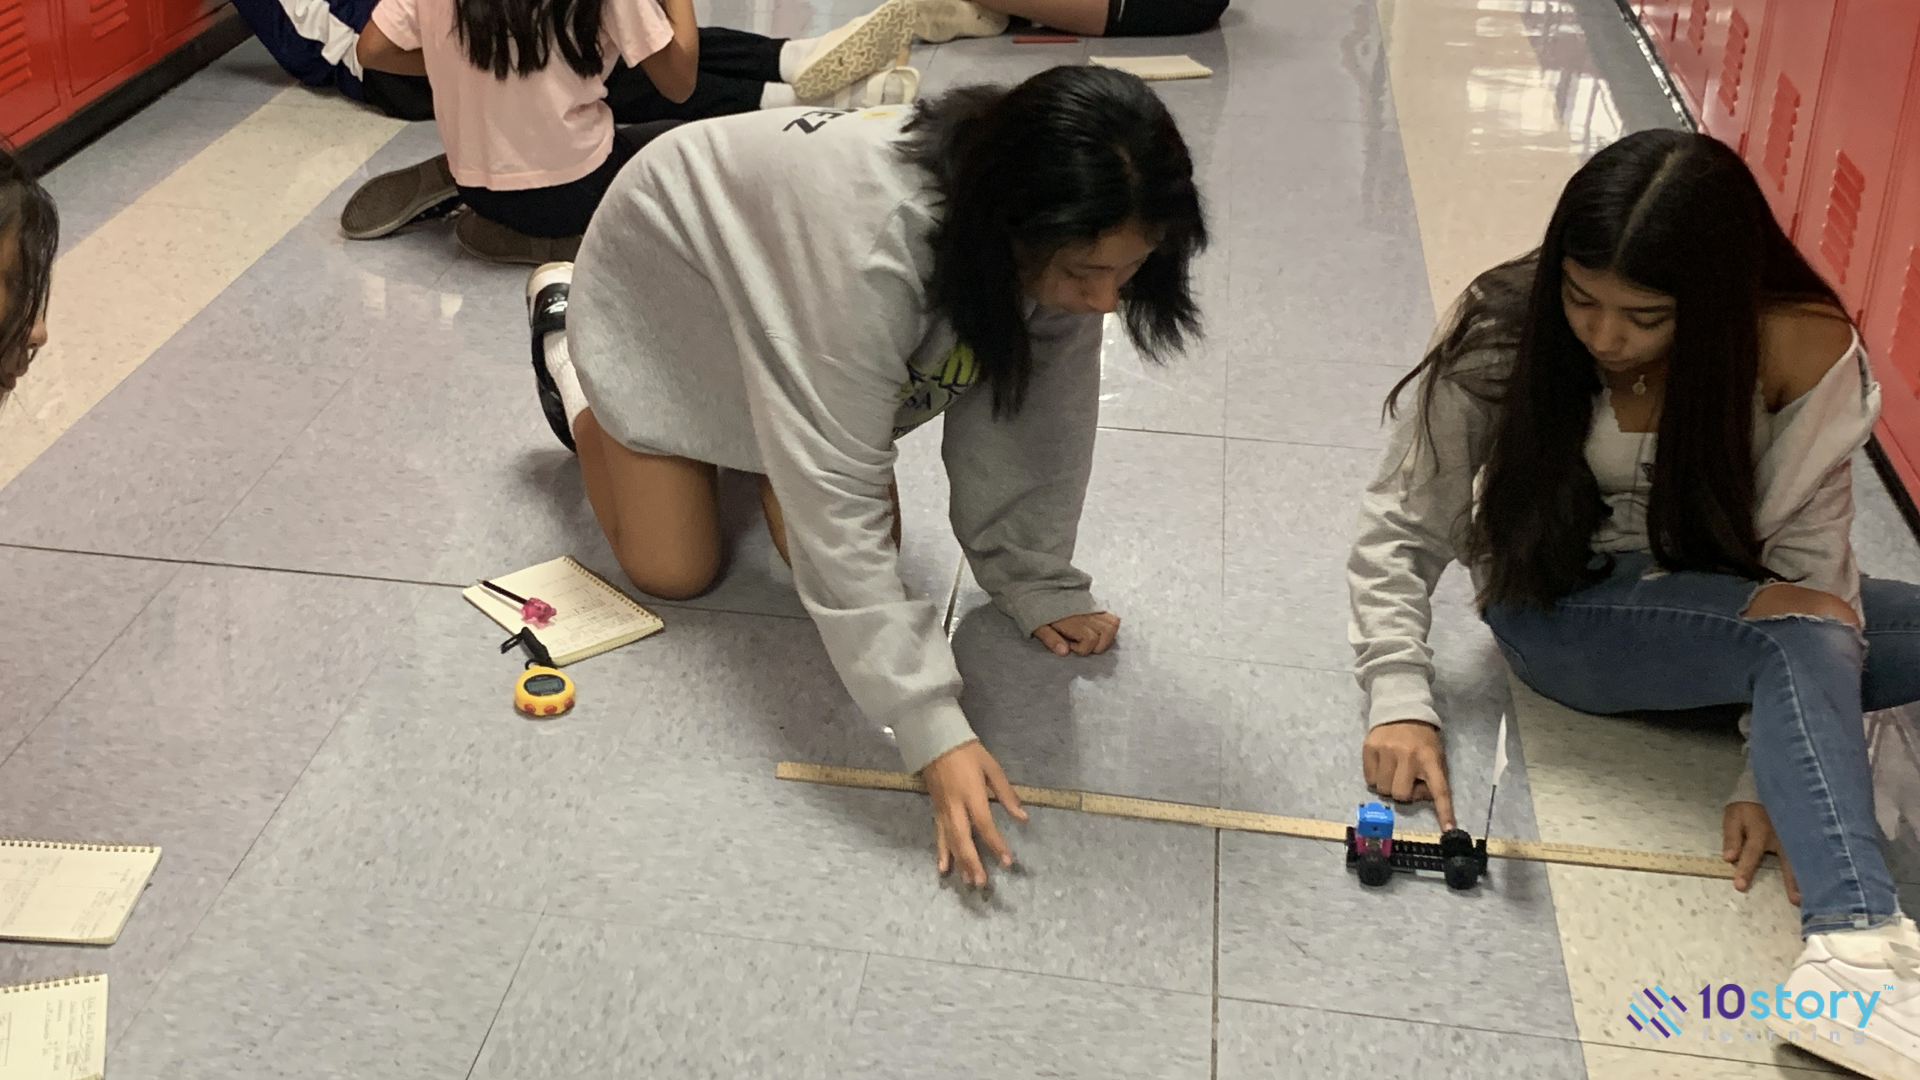
- Lessons 8–10: Constant rate exploration. Students run repeated trials at the same ramp height, calculate unit rate from their measurements, and plot distance vs. time on coordinate grids.
- Lessons 11–12: Unit rate — students compute and interpret unit rate from their own data.
- Lessons 13–14: Slope shows up in the data. Students calculate rise over run from their own graphs before encountering the formula.
- Lesson 15: Students write equations in y = mx + b form to model what their racer actually did.
- Lesson 16: Students add a motor. The Motor Racer moves at a steady speed on flat ground. They investigate how swapping gears changes the rate of change.
- Lesson 17: The Fair Race — students set up a race where one racer gets a head start, then figure out what the y-intercept means in the equation.
- Lessons 18–21: Grand Prix — each team must predict how far their racer will travel in a given time, using their equation.
Who It's For
- 7th–8th grade teachers looking for a hands-on supplement in rate, slope, and linear equations
- 9th grade teachers who need Algebra 1 foundations support
- Afterschool and summer program directors who want structured STEM programming that runs without specialized training
- Curriculum coordinators looking for standards-aligned supplements that work alongside any core curriculum — no adoption process required
What's in the Kit
All materials are physical and fully durable — buy once, use every year.
- Circuit Cubes™ kits (motorless + motor)
- Ramp kits
- Tape measures and stopwatches
- Graphing sheets and data recording forms
- Gear investigation materials
- Grand Prix competition materials
- Equation worksheets and prediction sheets
- Quick reference booklet
21 Lessons at a Glance
Every lesson runs through a web-based slide portal at algebrastudio.org. Howie is the on-screen instructor in embedded video mini-lessons — he introduces each task, demonstrates the math, and walks students through the activity. The slides run the session. Open the kit, follow the slides, and go.
Lessons run between 45 and 90 minutes, with some extending longer at the teacher's discretion. The curriculum works as a daily block (6–7 weeks), a twice-weekly enrichment (10–14 weeks), or an afterschool/summer program. It supplements any core curriculum — students learn rate, slope, and linear equations through their regular instruction, and Slope Lab is where they apply those concepts with physical materials and collaborative problem-solving.
Sample Lessons
Standards by Lesson
Slope Lab covers proportional relationships, unit rate, slope, and linear equations (y = mx + b) — standards in your grade 7–8 scope and sequence. It doesn't replace your core instruction on these topics. It gives students a place to apply what you're already teaching, using physical materials and collaborative problem-solving.
| # | What Students Do | Standards |
|---|---|---|
| 1–4 | Build racer & collect data — rate & patterns | 7.RP.A.2 |
| 5–7 | Constant vs. changing rate | 7.RP.A.2, 8.EE.B.5 |
| 8–10 | Constant rate exploration — proportional relationships | 7.RP.A.2 |
| 11–12 | Unit rate — compute & interpret | 7.RP.A.1 |
| 13–14 | Graphing & slope — rise over run from data | 8.EE.B.5, 8.F.A.3 |
| 15 | Writing equations — y = mx + b | 8.F.A.3, 8.EE.B.6 |
| 16 | Gear investigation — rate of change | 8.F.A.2, 8.F.B.4 |
| 17 | The Fair Race — y-intercept | 8.F.A.3, 8.EE.B.6 |
| 18–21 | Grand Prix — predictions using y = mx + b | 8.F.A.1–3, 8.EE.B.5–6 |
Career & Workplace Connections
Each Slope Lab lesson includes a one-page Workplace Connection brief that profiles a professional who uses the same math students are learning that day. Examples include:
- A data analyst who reads slope on trend lines to interpret business performance
- An automotive engineer who calculates rate of change to optimize vehicle efficiency
- An urban planner who uses linear models to project infrastructure demand over time
These profiles connect academic content to career pathways across data science, automotive engineering, energy, and urban planning.
Professional Development
It's easy to lead Slope Lab — the teaching portal provides step-by-step guidance.
Professional development for Algebra Studio focuses on teaching practice — structuring hands-on learning, facilitating collaborative problem-solving. Led by a nationally recognized math educator, teachers work through a Slope Lab session as learners — rolling racers down ramps, measuring distance and time, plotting data, and calculating slope from their own graphs. Then they unpack the teaching moves with the facilitator: how to structure the teamwork, where students get stuck, what questions to ask, when to step back.
Details
- Half-day workshop, up to 30 participants
- $3,495
- Led by a nationally recognized math educator
- Teachers experience a full lab session as learners, then unpack the pedagogy
- Fundable through Title II-A professional development funds
Evaluation Partnership
Structure a rigorous study using your own assessments, your own comparison groups, and your own timeline.
Research Design Options
Option A
Simple Pre/Post
Administer a brief assessment before and after the Lab, using district benchmark questions or the Algebra Studio assessment.
Option B
Delayed-Start RCT
Half of participating classrooms begin first, the other half a few weeks later. Assess all students after the first group completes the project. Use an Algebra Studio pre/post or your own assessment.
Option C
Matched Comparison
Compare participating classrooms to non-participating classrooms with similar demographics and prior achievement.
Option D
Implementation + Perception Study
Document implementation fidelity, student engagement, and teacher perception alongside quantitative measures.
Kit
Slope Lab is part of the Essentials bundle — you get both Slope Lab and Balance Lab in one kit.
Classroom Kit
Full-class size — materials for both Slope Lab and Balance Lab.
- K'Nex™ balance kits + cups & cubes
- Circuit Cubes™ Gravity Racer kits
- Ramp kits, tape measures, stopwatches
- Game cards, equation mats, worksheets
- Access to all printables
Cost Per Student
$1,695 ÷ 28 students = $61 per student for 35+ hours of instruction across both labs. All materials are fully durable — buy once, use every year. Year 2+ cost: $0.